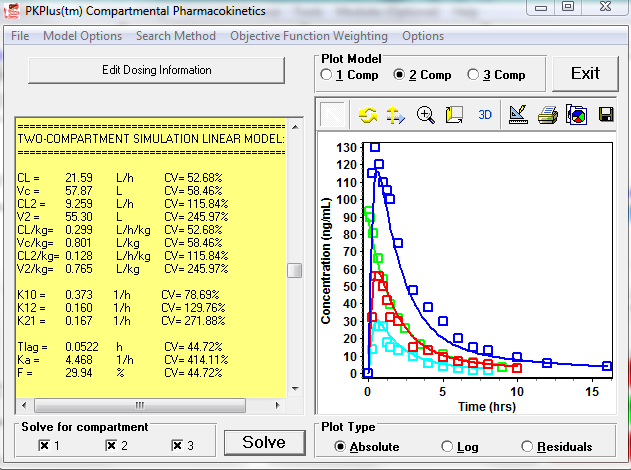
The PKPlus™ Module extends GastroPlus® to rapidly estimate pharmacokinetic (PK) parameters for noncompartmental analysis (NCA), along with 1-, 2-, & 3-compartment PK models from pharmacokinetic studies (IV and/or oral) without the need to run full simulations. The optimization and selection of the appropriate compartmental PK model is automated from a single mouse click, but you control which parameters are transferred back to the main GastroPlus model.
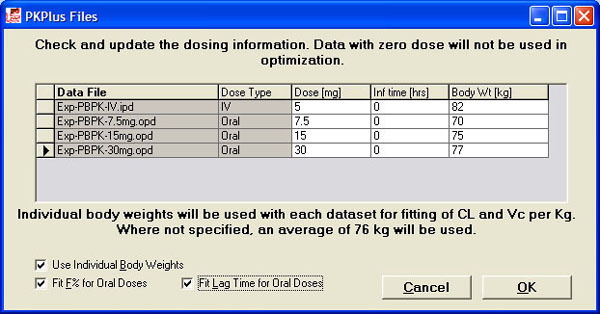
The fitted parameters include PK properties, first order absorption rate, bioavailability and absorption lag time (if both IV and oral data are included in fitting). Required inputs are plasma concentration vs. time profiles, dose, body weight and infusion time (if applicable). Compartmental PK models can be fitted to single IV or oral data as well as across multiple plasma concentration vs. time profiles – IV, oral, or combination of IV and oral as well as different dose levels. Linear or saturable clearance models can be easily selected.
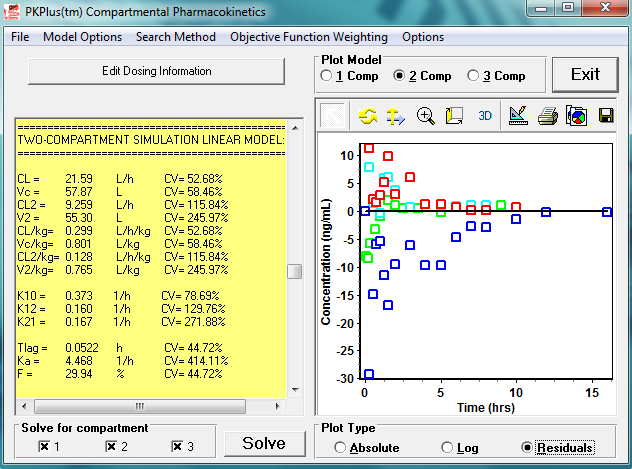
Full statistics, including Akaike Information Criterion and R^2, are provided for all models. Residual information is also captured and can be plotted. Once finished in PKPlus, the parameter values of the selected model can be easily transferred back to the main GastroPlus model, and report-quality outputs can be captured and saved.