
Metabolism plays a critical role in the bioavailability of drugs, food additives, agrochemicals, and industrial chemicals. It is also important in understanding drug-drug interactions (DDI). The cytochrome P450 enzymes (CYPs) are probably the most significant class of Phase I metabolizing enzymes, accounting for the majority of Phase I metabolic transformations of most drugs. Knowledge of the specific metabolites resulting from these transformations is often important in understanding toxicities, efficacy (in the case of prodrugs), and clearance, along with many other key aspects of drug pharmacokinetics. Thus, models for metabolite prediction can be very useful in drug design and toxicity.
01. Discover
What is the Metabolism Module?
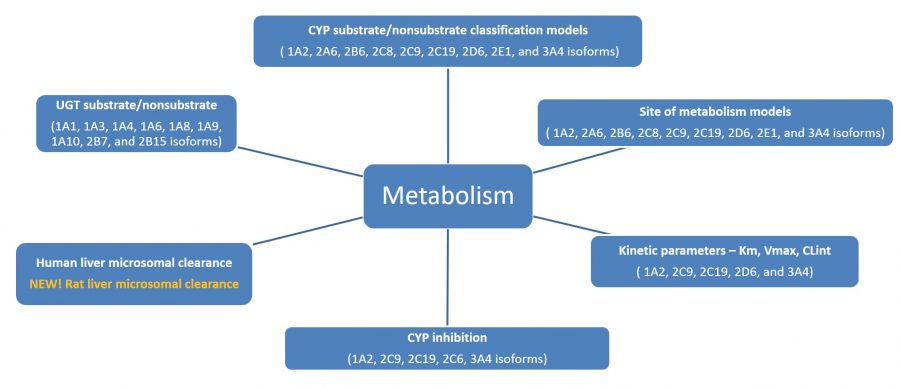
The Metabolism Module in ADMET Predictor allows you to predict:
- Cytochrome P450 sites of metabolism and metabolites for nine CYP isoforms
- CYP kinetic parameters (Km, Vmax, CLint) for the five major drug metabolizing CYPs
- CYP inhibition for the five major drug metabolizing CYPs
- Human and rat liver microsomal unbound intrinsic clearance
- UGT substrate for nine UGT isoforms
The HLM CLint models were updated with additional data in ADMET Predictor 9.0.
All 9 CYP substrate, all five CYP inhibition, and all nine UGT substrate models were rebuilt to improve their estimates of prediction confidence
Additional information on this module is provided below.
02. Explore
Models included in the Metabolism Module
-
Models included in the Metabolism Module
The image on the left lists the models in the Metabolism module. The rat liver microsomal unbound intrinsic clearance model was added in ADMET Predictor version 8.5.
-
Human Cytochrome P450 Metabolism
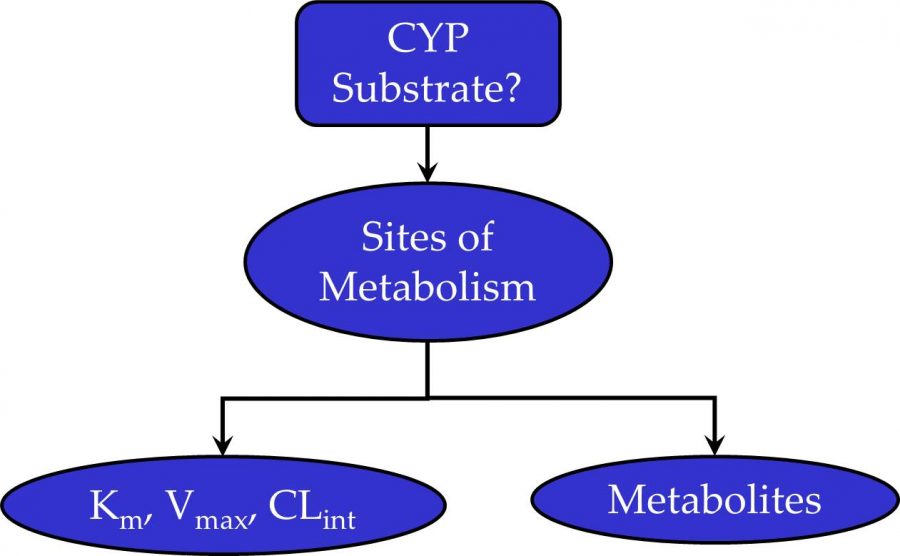
The cytochrome P450 metabolism models evaluate molecules using a “tiered” approach. In the first tier, the molecule is accessed as a nonsubstrate or substrate for nine CYP isoforms. Next, sites of metabolism (SOM) are predicted for isoforms where the nonsubstrate/substrate model predicts the compound to be a substrate. The SOM models use atomic descriptors, some of which are derived from Huckel and EEM semi-empirical molecular orbital calculations. Metabolites are generated using SMIRKS strings to specify the transformations predicted by the SOM models. The metabolites can be displayed in MedChem Designer™. They can also be generated in ADMET Predictor in batch mode. Finally, CYP kinetic parameters, Km, Vmax, and CLint, are predicted from ANNE regression models.
-
Substrate Classification Models for Human Cytochrome P450
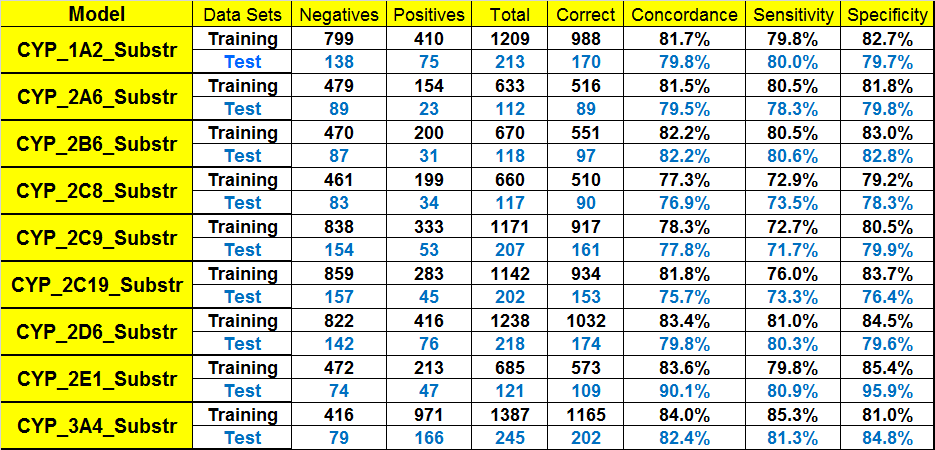
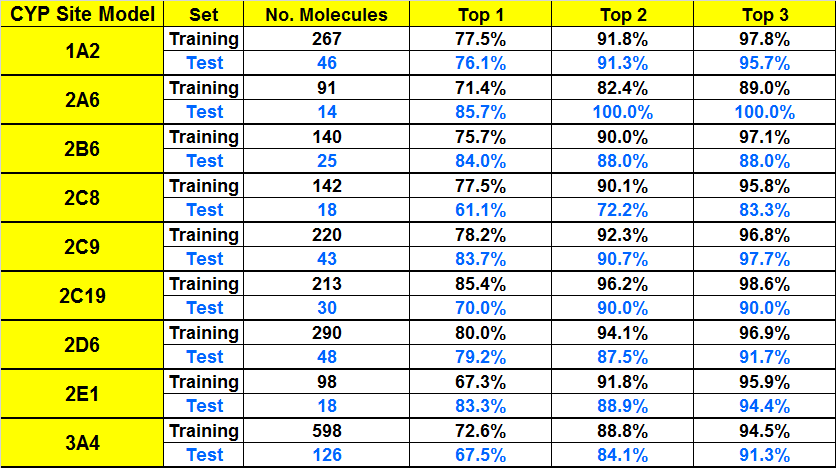
Substrate classification models for nine CYP isozymes involved in Phase 1 metabolism are provided. The data sets were compiled from the Accelrys Metabolite database (the successor to which is now distributed as the BIOVIA Metabolite database), Drugbank database, as well as other public resources. Significant data curation efforts have been carried out with the original research literature. A large number of errors in the literature and databases, such as incorrect chemical structures and incorrect enzyme information, have been identified and corrected. Performance statistics for each of the models are shown in the table on the left.
-
Models of Regioselectivity (Likely Sites of Metabolic Attack) for Human Cytochrome P450 Enzymes
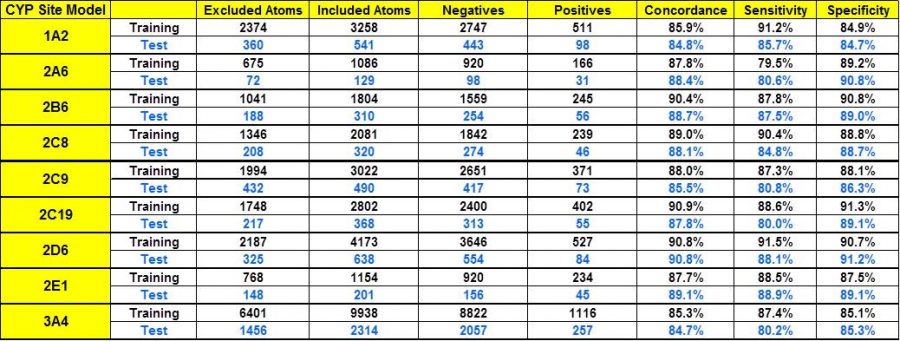
Complementing our substrate classification models, we have also developed models for predicting atomic sites of metabolic oxidation for CYP isoforms 1A2, 2A6, 2B6, 2C8, 2C19, 2C9, 2D6, 2E1, and 3A4. The datasets used to train the models make use of our own extensively curated and updated version of the BIOVIA Metabolite database for the majority of reactions and associated literature references. Other data sources included published datasets of sites of metabolism and general review articles. The data underwent substantial curation based on information contained in original literature citations as well as additional references found in the course of this work. These curation updates included corrections to reactant and product structures, CYP assignments, and often additional sites identified in more recent publications. Some site assignments were removed when further literature investigations revealed the particular reaction in question was mediated by a different CYP or even a non-CYP enzyme. The table on the left shows the performance statistics for the CYP sites of metabolism models. “Excluded atoms” that were not candidate sites by virtue of chemistry rules (e.g., carbons without hydrogen) were excluded from the ANNE model building process.
An alternative metric for SOM prediction performance frequently presented in the literature is to tabulate the percentage of molecules possessing an experimentally confirmed site of metabolism among one of its top N scoring atoms, according to the model. For example, if N=2, then a prediction is counted as “correct” if one of the top 2 scoring atoms in the corresponding molecule is a metabolic site. We present the performance statistics for our site models on the left using this metric for values of N=1, 2, or 3 for comparison to such publications.
-
CYP SOM Propensity Scores
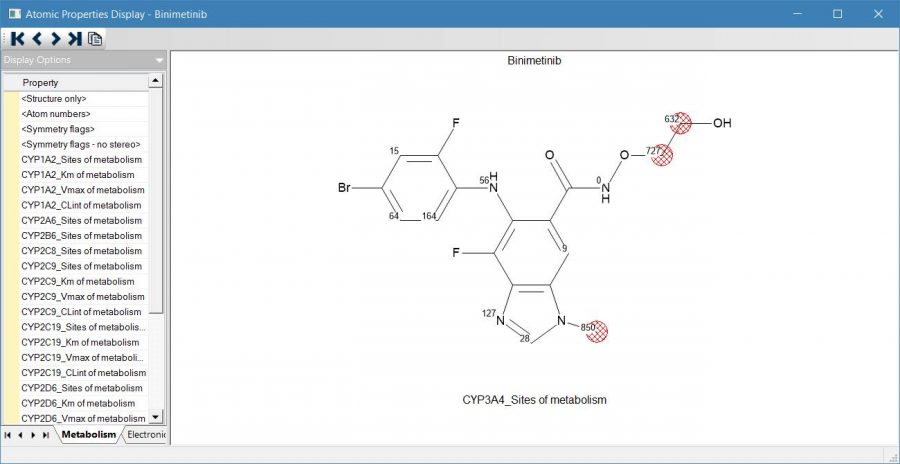
Each candidate atom of a molecule receives a continuous score (a propensity towards metabolic attack) from the site model for a given CYP. The highest scoring atom of a given molecule is classified as a site (unless the score is below a predetermined threshold) and all other atoms of that molecule within a predetermined fraction of that score are also assigned as sites. The atomic scores and the site assignments may be viewed in the “Structure Visualization” window within ADMET Predictor. A sample display of atomic CYP scores is shown on the left.
The scores range from 0-1000 with higher scores indicating a greater likelihood of being a metabolic site. The highest scoring atom is highlighted with a red hashed circle. Other atoms with scores near the maximum are also highlighted. Atoms that are not candidate sites are not assigned a score.
-
Grey versus Red highlighting
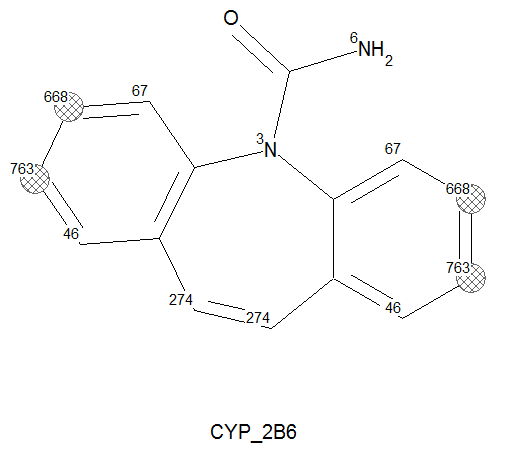
Many factors determine WHETHER a molecule is actually an observed substrate, e.g. condition-dependent chemical kinetics. The atom properties that make it a site of metabolism are independent of whether or not the molecule is a substrate and, hence, can be metabolized. Consequently, the site prediction displays depend on the corresponding CYP substrate classification models described above. If the molecule is predicted to be a non-substrate, then the corresponding “Structure Visualization” display does show predicted sites highlighted with gray (rather than red) hashed circles as seen in the image on the left. In other words, gray highlights mean: “this/these would be likely atomic site(s) if the molecule were a substrate”.
-
Kinetic Models for Metabolism by Human Cytochrome P450 Enzymes 1A2, 2C9, 2C19, 2D6, and 3A4 and liver microsomal clearance
The Michaelis-Menten constant (Km), a measure of the affinity of the enzyme for its substrate, maximum metabolic rate (Vmax), and intrinsic clearance CLint are three important parameters of the activities of cytochrome P450 enzymes. Different metabolites are possible for the same molecule and the same enzyme, and they are usually formed with different rates.
Within its Metabolism Module, ADMET Predictor provides human CYP450 enzyme kinetic models that predict Km, Vmax, and CLint for the five major CYP isozymes (1A2, 2C9, 2C19, 2D6, and 3A4). It is crucial to understand that these models are resolved atomically, i.e., the three kinetic parameters are predicted for each detected site of metabolic attack. The models were developed using Artificial Neural Network Ensemble (ANNE) methodology and 2D molecular descriptors. Although the three models were developed independently, their outputs have been reconciled to always obey the CLint = Vmax / Km relationship. The predicted parameter values can be used GastroPlus™ to perform human physiological pharmacokinetic/pharmacodynamic (PK/PD) simulations for the purposes of risk assessment and to support decision-making in drug discovery.
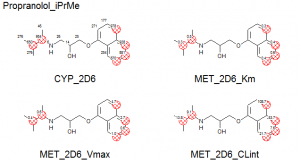
The images on the left show plots of the regression models for one of the CYP isoforms and the various predicted values overlaid on top of the molecule.
HLM and RLM unbound intrinsic clearance models are also included in the Metabolism module. The fraction unbound to liver microsomes (S+fumic) were applied to the experimental data to convert it to the unbound form.
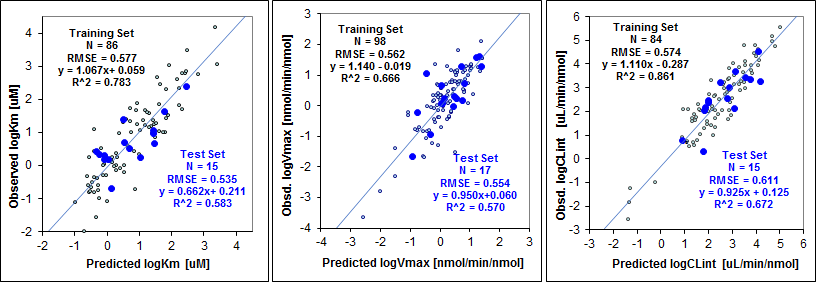
ADMET Predictor MET_2D6_Km (left), MET_2D6_Vmax (center), and MET_2D6_CLint (right) Models’ Performance
-
Inhibition Models for Human Cytochrome P450 Enzymes 1A2, 2C19, 2C9, 2D6, and 3A4
The inhibitory potency of drugs against cytochrome P450 is important for the study of drug toxicities and drug-drug interactions. The ADMET Predictor™ CYP P450 inhibition classification package includes four global inhibition models for CYP 1A2, 2C19, 2C9, 2D6, and 3A4 isoforms, as well as two substrate-specific inhibition models for Human Liver Microsome (HLM) CYP 3A4 with midazolam as a substrate and recombinant expressed CYP 3A4 with testosterone as a substrate.
The inhibitor/non-inhibitor cutoff values were set at Ki = 30 uM for CYP 1A2. Exact threshold values for the remaining models remain unknown, since the training databases for these models contained only binary indicators. Non-substrates which have not been identified as inhibitors for CYP 2C19, were accepted as non-inhibitors, as very little non-inhibitors for CYP 2C19 have been publicly identified.
In addition, ADMET Predictor features two regression models for predicting the substrate-specific inhibition constant, Ki, values in microM for HLM CYP 3A4 with midazolam and recombinant expressed 3A4 with testosterone as substrates, respectively.
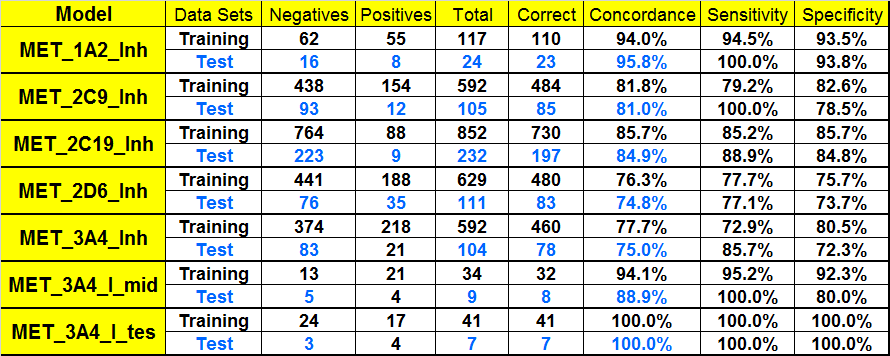
Performance of Inhibition Models of CYP P450 1A2, 2C19, 2C9, 2D6, and 3A4.
Performance of Inhibition Models of CYP P450 1A2, 2C19, 2C9, 2D6, and 3A4.
-
Probability of Metabolism by Human Uridine 5'-Diphosphate-Glucuronosyltransferases (UGT)
The UGT enzymes, distributed in various organs in the human body, catalyze in Phase II metabolism the glucuronidation reaction (the formation of a linkage between glucuronic acid and a nucleophile) leading to an easier elimination of xenobiotics. Some compounds are directly catalyzed by UGTs without ever having first been metabolized by Phase I enzymes. Most of these enzymes in humans are produced by the liver, but one, UGT 1A10, is generated by the GI tract.
We have developed classification QSAR models from literature data for nine UGT isozymes that cause Phase II drug metabolism: UGT1A1, UGT1A3, UGT1A4, UGT1A6, UGT1A8, UGT1A9, UGT1A10, UGT2B7, and UGT2B15. The UGT models predict whether a compound will be metabolized by one or more of these enzymes and were developed using the Artificial Neural Network Ensemble (ANNE) training methodology. Independent test sets were used for the validation of all models.
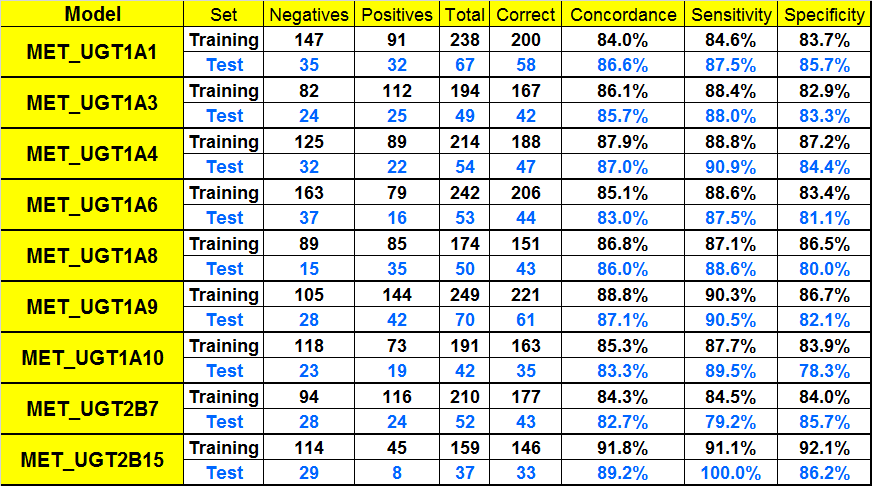
Performance of Classification Models for UGT-mediated Metabolism
03. Resources
Explore Resources