Monolix is the most advanced and easy-to-use solution for non-linear mixed effects modeling (NLME) for pharmacometrics. It is based on the SAEM algorithm to provide robust, global convergence even for complex models, and is equipped with a user-friendly interface to ensure a simple and fast workflow.
01. PROMO
What's new in MonolixSuite 2024
02. Discover Monolix
Easy-to-use Solution


-
Less programming for you and more time to explore models and results thanks to a user-friendly environment with a modern graphical interface design, intuitive workflow, clear display of settings and results, and interactive data visualization.
-
Fast and efficient model development using built-in libraries with more than 30 thousand editable models, automatic algorithms for initialization, advanced model building tools, and a full set of interactive diagnostic tools.
- Confidence and reliable convergence for all types of data, sparse data sets, and complex models thanks to the innovative implementation of the SAEM algorithm.
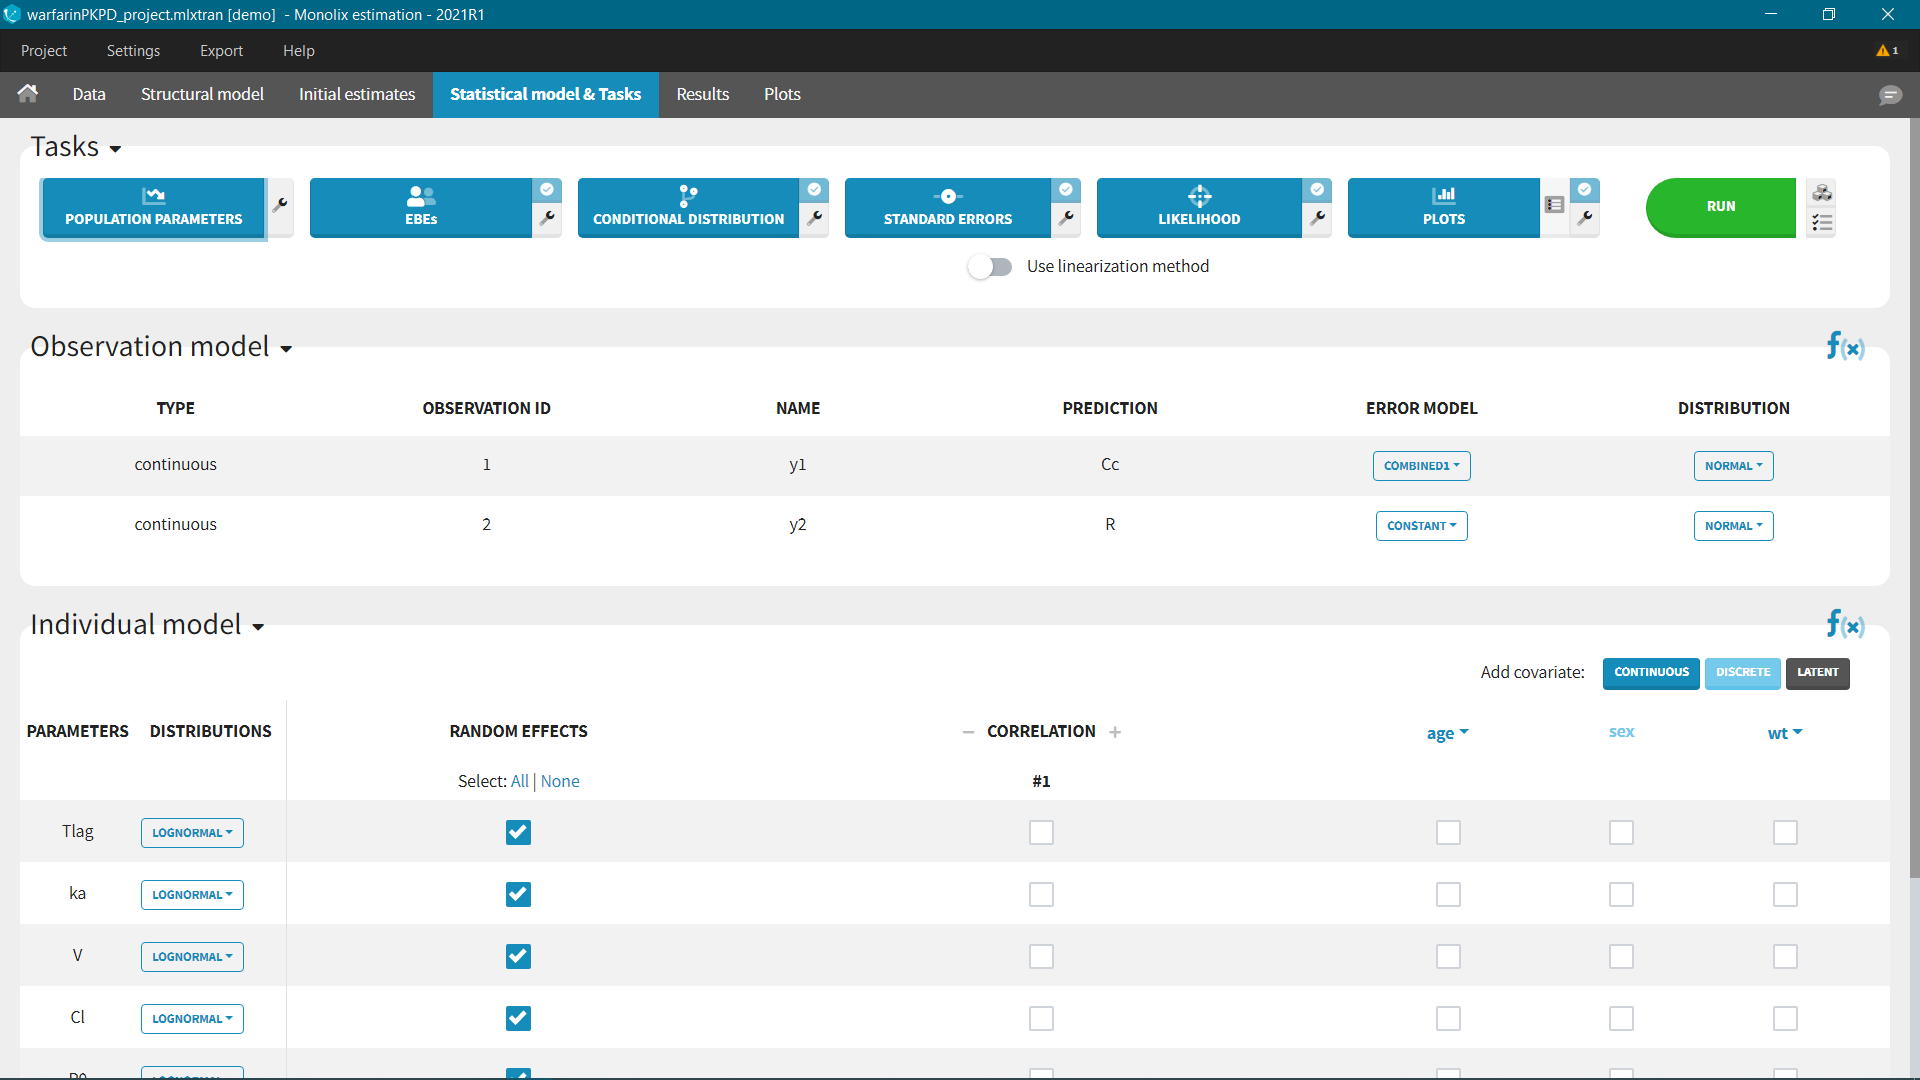
Very easy to use with the GUI
Designed for ease of use with a modern, user-friendly graphical interface. Simple and intuitive workflow means less programming for you and more focus on exploring models and pharmacology.
Advanced statistical methodologies
Lixoft, in collaboration with Inria, pioneered the implementation of the SAEM algorithm. Reliable convergence for all types of data and innovative automatic model building tools are a centerpiece in population modeling provided by Monolix.
Automated generation of diagnostic plots
Automatic generation of a full set of diagnostic plots gives immediate feedback, while the interactive features assure to make the most of the analysis. In only a few clicks you create the VPC, split it by any patient subgroup, adjust axis settings, and export it to a report.
Increased productivity and quality
Efficient C++ solver package, standardized model language Mlxtran, built-in model libraries, integrated automatic tools and interoperability across other applications in the Suite all contribute to better productivity and quality or the results.
03. Monolix WHAT & HOW
Novel Approaches
Support of all relevant data types and statistical features for population modeling
For all cases, the right statistical methodology has been developed to properly handle modeling and parameter estimation processes. Monolix covers:
- Continuous, categorical, count and time to event data (or any combination)
- Mixture models and mixtures of models
- Inter-occasion variability with any number of levels
- Normal, lognormal, logit, probit and user defined distributions for the individual parameters
- Proper handling of BLQ data
- Effect of covariates (continuous and categorical) and correlations
- and more
Mlxtran, model libraries, mlxEditor and Sycomore
Mlxtran – a human readable language designed for custom-build models; a simple, yet powerful, suitable for simple as well as complex systems Pharmacology models.
Built-in Monolix libraries – fully documented, open-source libraries with more then 30000 models, from PK, PKPD, count/categorical/time-to-event, to TMDD, parent-metabolite and tumor growth. Analytical solutions, which are implemented for a large class of models, together with the automatic initialization procedures available for any model assure the highest performance of parameter estimation.
mlxEditor – advanced text editor, integrated with Monolix and equipped with a dedicated syntax check for the Mlxtran language.
Sycomore – interconnected application for systematic and visual management of Monolix projects and direct models’ comparison.
Outputs and plots
All results are displayed in sortable and formatted tables easy to copy in any document and exported in the result folder in an R-compatible format. Interactive diagnostic plots are also automatically generated for straightforward interpretation of the results.
R API to automate your process
All steps performed in Monolix can be run from R with the LixoftConnectors package. What you have done once intuitively in the interface for a specific project can be generalized to a script automating the process for any other dataset and model.
Comprehensive documentation and examples
Great care has been taken to provide the user with a comprehensive Monolix documentation that includes methodology, software manuals and tutorials.
A wide collection of examples that include models and data can be used as templates to start your own project.
A lot of online material (feature of the weeks, webinars, …) on our MonolixSuite Youtube channel.
Monolix has been widely used by pharmaceutical companies and smaller biotech, as well as universities and research institutes, government agencies, hospitals, and non-profit organizations.
Some of the routine applications include:
- data visualization and interactive exploration with personalized charts options and stratification
- development of NLME models that include population characteristics and variability between and within individuals
- tests of modeling hypotheses with more than 30 000 models divided in several built-in libraries
- parameter estimation by SAEM algorithm for all types of data, with proper handling of preclinical, sparse, multidose and censored data
- analysis of effects of covariates using diagnostic plots, statistical tests, and automatic model building tools
- support for preclinical, clinical trials and treatment individualization
- conduct population modeling for tumor growth, QSP, C-QTc
Bootstrap: A new built-in module to provide a robust assessment of parameter uncertainty – alternative to calculating standard errors via inversion of the Fisher Information Matrix already in the Monolix GUI.
Plots presets: Possibility to transfer plot customization from one plot to another within the same project or across projects – saves time and effort when the same formatting options, such as stratification, preferences, or settings apply to multiple plots, similar analyses or datasets.
Improved data and plots loading times: Now the data and plots can be saved as binary files to make the le load faster.
Compatibility with Excel and SAS files
And more:
- Several versions of the same plot type
- Linear interpolation for regressors and possibility to use a regressors on the X-axis
- Hex code for plots coloring
- Analytical solutions in case of time varying covariates
- More settings of the ODE solver
- Additional optimization of algorithms
- Settings of convergence assessment, model building and bootstrap in one config file for parallel calculations on a cluster from the command line
04. Monolix EXPERTS
Meet The Experts

Géraldine Cellière
VP, Applications
Clinical Pharmacology & Pharmacometrics Solutions

Monika Twarogowska
Senior Principal Scientific Product Specialist

Pauline Traynard
Applications Manager
Clinical Pharmacology & Pharmacometrics Solutions
How do I move forward from here?
Request for a demo with Monolix to support internal research projects and regulatory interactions.