01. PROMO
What's New in MonolixSuite 2023

Very easy to use with its GUI

Designed for ease of use, which means less programming and more exploring and simulations. One simple workflow to analyze in real time the effect of different treatments and model parameters on a typical individual and to simulate a population of individuals in different groups.

Amazing flexibility

Intuitive interface with an amazing flexibility to describe any scenario. In a few clicks, integrated plugins define any population, model parameters and covariates, any treatment, and any design. Simulations of clinical trials have never been so simple.

Advanced Statistical Methodologies

Built-in tools perform post-processing of simulation outputs into outcomes and endpoints. Together with statistical tests and uncertainty analysis, they provide powerful qualitative and quantitative comparison between simulation groups.

Increased productivity and quality

Working independently and integrated with Monolix – build a simulation from scratch or import a Monolix project as a starting point. Efficient C++ solver package, standardized model language, and automatic display of results in interactive tables and plots all contribute to better productivity and quality.

03. SIMULX WHAT & HOW
Novel Approaches

Optimal environment to build and analyze simulation scenarios

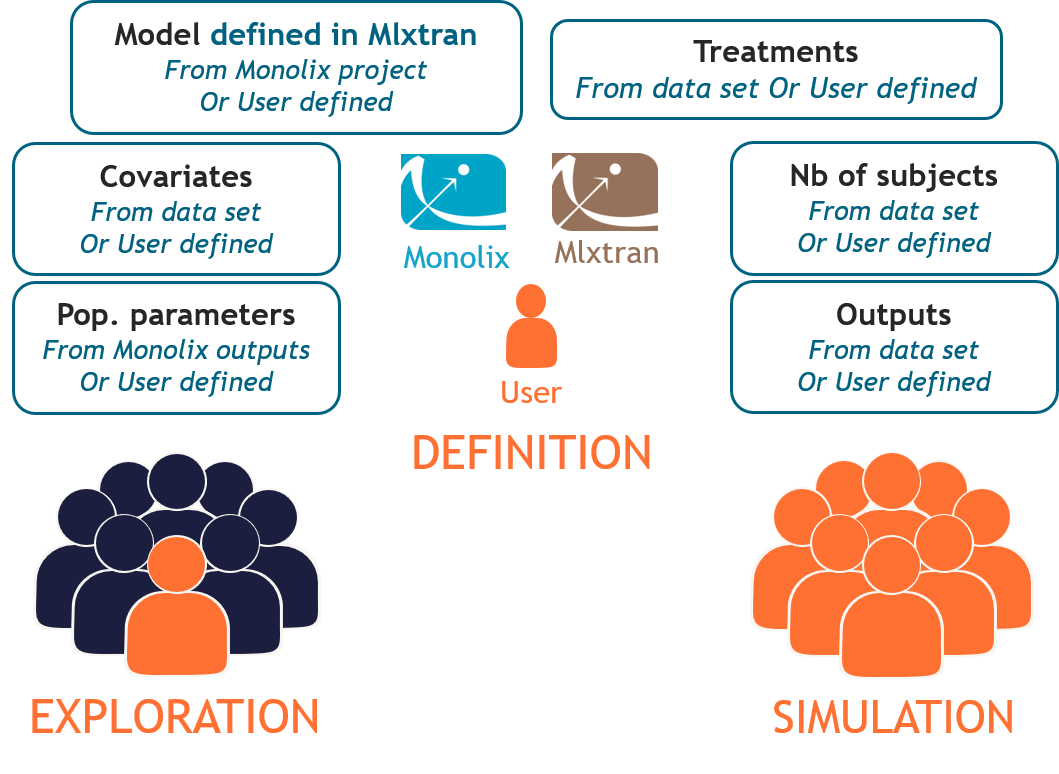
  • Definition – create easily new exploration and simulation elements (parameters, treatments, outputs, covariates, etc.) of different types using built-in methods or external tables
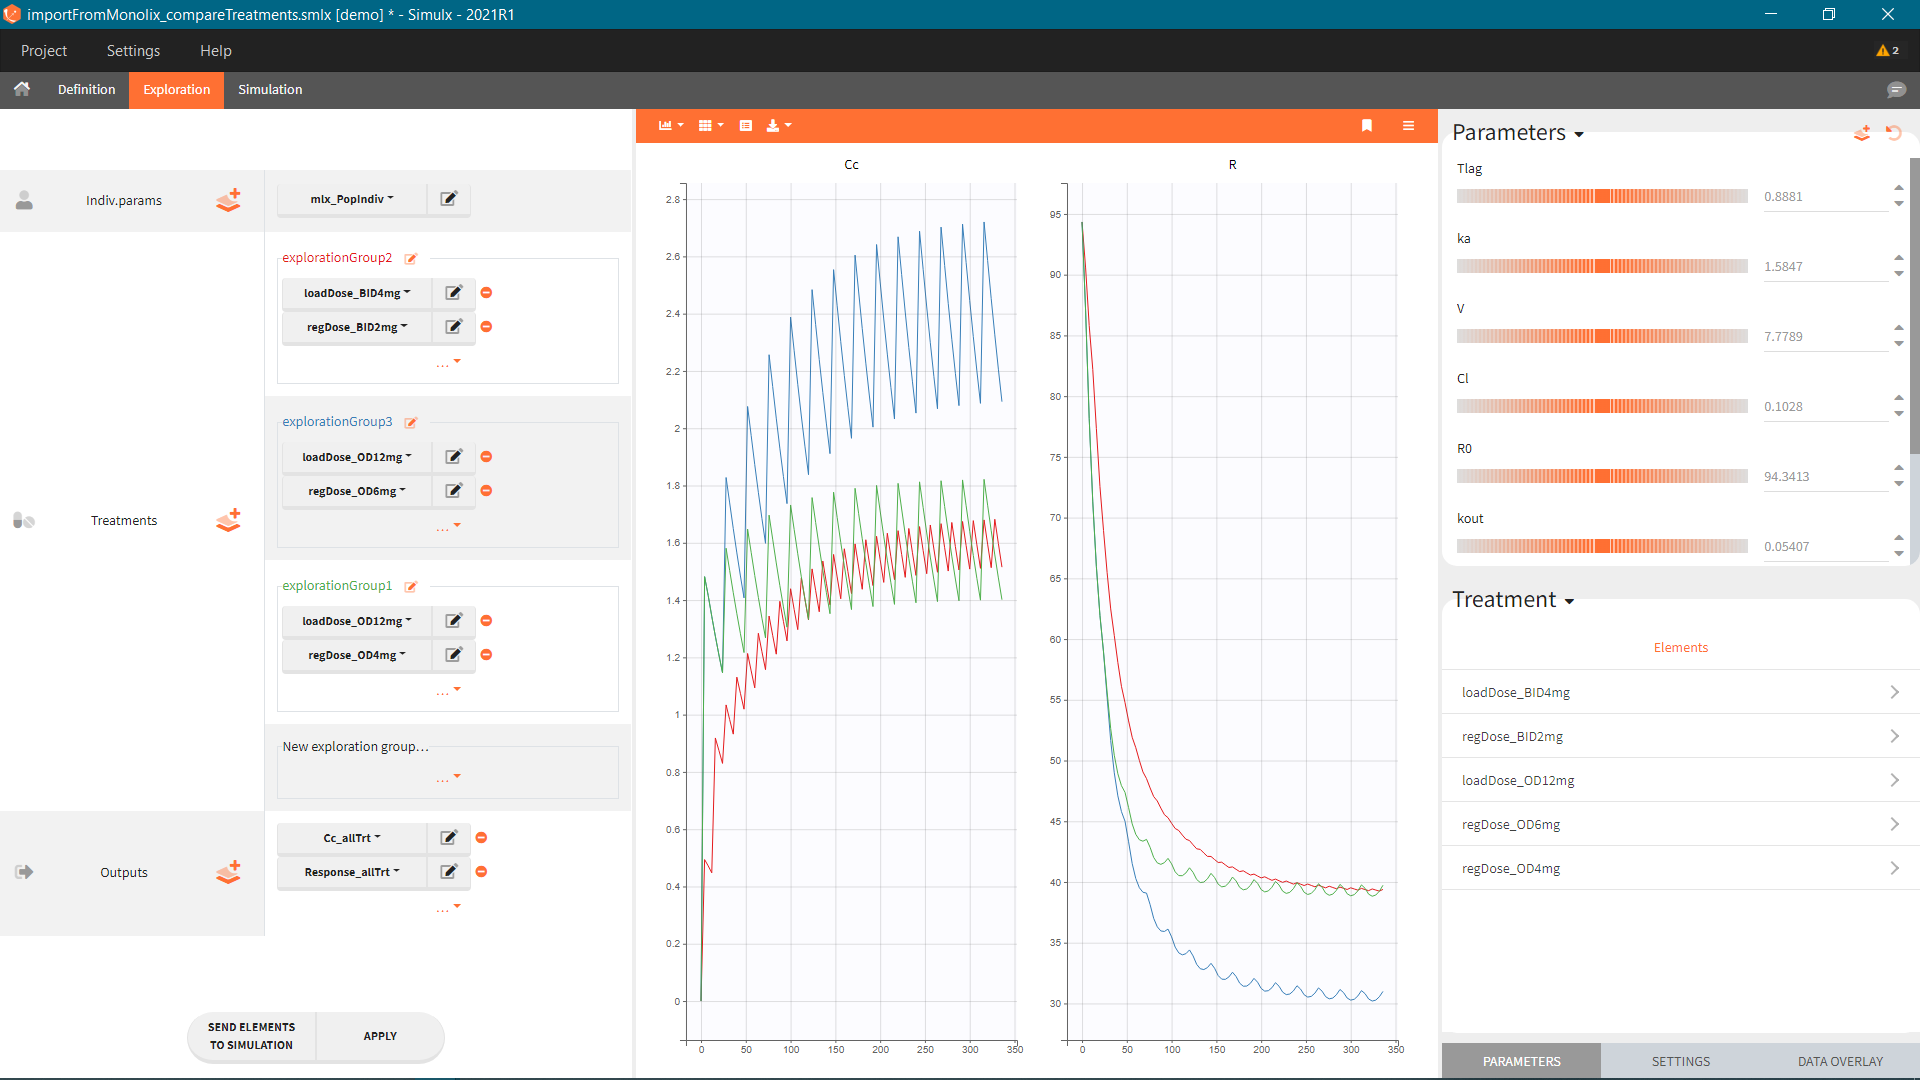
  • Exploration – analyze in real time different treatments and effects of model parameters by simulating a typical individual; create several exploration groups, overlay experimental data and send a scenario in a single click to a clinical trial simulation
  • Simulation – simulate clinical trials using a population of individuals in one or several groups with specific treatment, individual characteristics or measurement times; use flexible post-processing tools, and get immediate feedback in intuitive exportable tables and interactive plots.

Outputs and plots

All simulation outputs are displayed in sortable and formatted tables easy to copy in any document and are exported in the result folder in an R-compatible format. Interactive plots are also automatically generated for straightforward interpretation of the results.

R API to automate your process

All steps performed in Simulx can be run from R with the LixoftConnectors package. What you have done once intuitively in the interface in a specific scenario can be generalized to a script automating the process for any other simulation or design optimization.

Comprehensive documentation and examples

Great care has been taken to provide a comprehensive Simulx documentation that includes methodology, software manuals and tutorials.
A wide collection of examples that include models and data can be used as templates to start your own project.

A lot of online material (feature of the weeks videos, webinars, case studies, …) on our Lixoft University page.

Simulx has been widely used by pharmaceutical companies and academics to:

  • Make more informed decisions with reliable and extended analysis of possible scenarios.
  • Compare different dosing regimens and find the most promising ones in terms of safety and efficiency.
  • Assess the uncertainty in a clinical trial, calculate the expected power of a study, and select the most successful design.
  • Use results of one phase of a clinical trial to optimize treatment, sample size and duration of the next phase.

CHECK OUR VIDEO TUTORIALS


Global interoperability

Extended interoperability with export between all MonolixSuite applications. In addition to the exports/imports already available, it is now possible to:

  • Export a PKanalix CA run to Simulx to predict PK for new dosing regimens.
  • Export simulations from Simulx to PKanalix for NCA analysis.

More flexibility

  • Mapping of the simulated ids to the original ids from Monolix/PKanalix or external elements
  • Multiple output distributions for different simulation groups in one chart
  • New elements after import from Monolix
  • Conversion of individual elements to population elements, and vice versa
  • Feedback on the software directly from the GUI

Extended outcomes and endpoints

More post-processing possibilities to calculate:

  • the duration below, above or between specific values
  • the value of the output at a custom time,
  • normalization relative to min/max values (in addition to baseline)
  • times of min/max as continuous or event type

LixoftConnectors

  • New functions to define outcomes and endpoints
  • Extensive documentation of Simulx connectors with detailed description and working examples for every function.


04. SIMULX EXPERTS
Meet The Experts

How do I move forward from here?

Request for a demo with Simulx to support internal research projects and regulatory interactions.